Optimizing PostgreSQL queries using pg_stat_statements
Postgres comes with a number of really powerful tools to help analyze query and overall database performance. Here's how I usually go about finding and improving query performance.


Postgres comes with a number of really powerful tools to help analyze query and overall database performance. Here's how I usually go about finding and improving query performance.
pg_stat_statements
This extension is extremely powerful. It normalizes queries and logs their performance. What is query normalization, you ask?
Let's take a simple query like:
SELECT * FROM users AS u JOIN messages AS m ON u.id = m.user_id WHERE u.name = 'geekmonkey';It's easy to imagine this query also being performed for other users (where u.name differs). Query normalization takes a query and abstracts the variable bits so that similar queries can be grouped together. Above query might be represented as:
SELECT * FROM users AS u JOIN messages AS m ON u.id = m.user_id WHERE u.name = $1;The pg_stat_statements extension has been available in Postgres for a long time. Query normalisation was only added in version 9.2 however. Both Heroku and
AWS RDS come with support for the extension and enabling it is as easy as executing CREATE EXTENSION pg_stat_statements.
After enabling the extension it is advisable to let it run for a while so that it captures realistic production traffic. Note that the extension won't really help you in development or staging environments as those rarely experience comparable load nor have the same amount of data.
SELECT rolname,
    calls,
    total_time,
    mean_time,
    max_time,
    stddev_time,
    rows,
    regexp_replace(query, '[ \t\n]+', ' ', 'g') AS query_text
FROM pg_stat_statements
JOIN pg_roles r ON r.oid = userid
WHERE calls > 100
AND rolname NOT LIKE '%backup'
ORDER BY mean_time DESC
LIMIT 15;
The query is an adapted version of the one posted by Dan McGee. I'm using it in a slightly modified way to also display the maximum query time and standard deviation. This query not only helps you identify slow queries, but also queries where performance varies significantly.
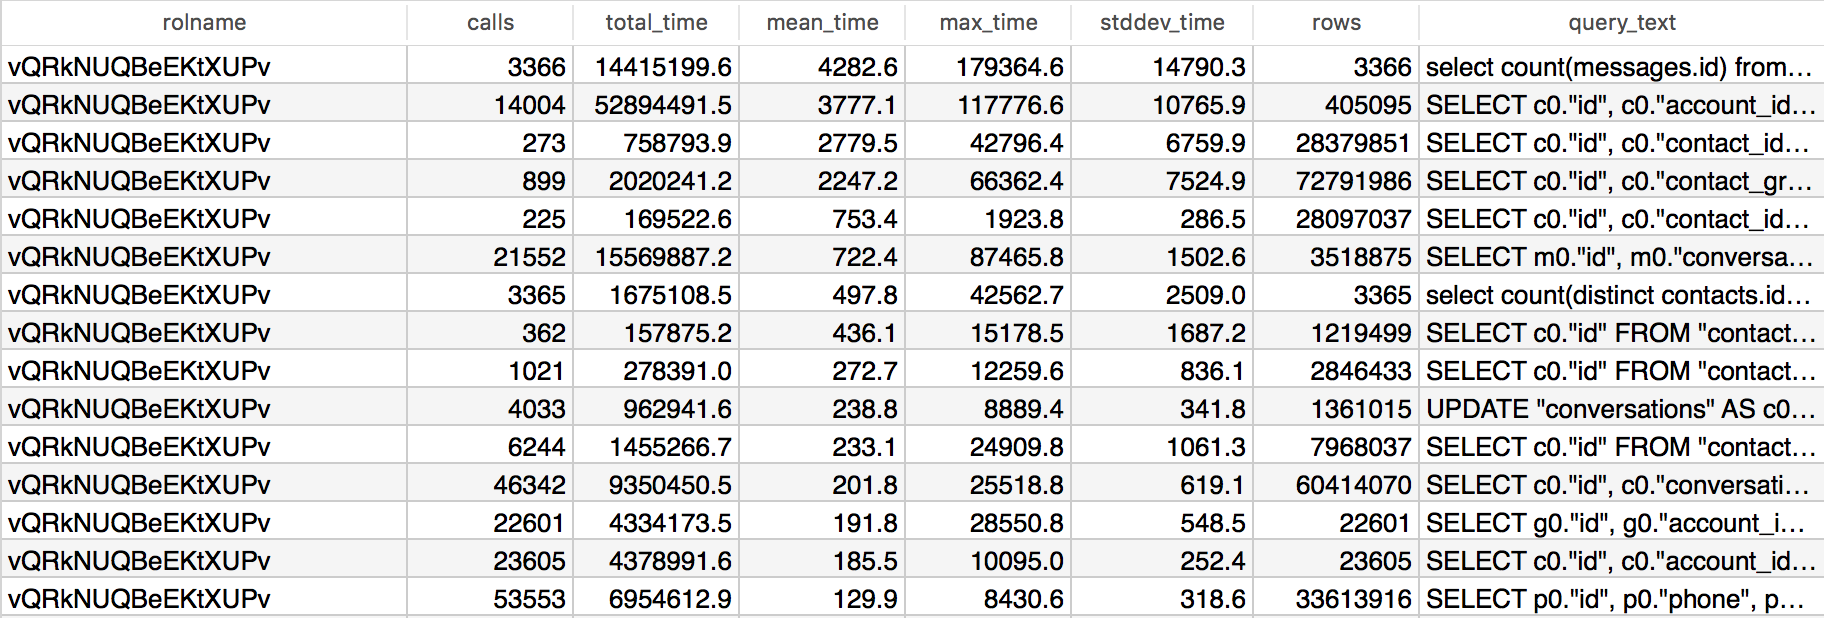
Generally you should aim for queries to perform in less than 100ms. The screenshot above shows a number of queries that greatly exceed 100ms. Now, it may be tempting to jump on the first query in that list and try to optimize it. After all a mean execution time of over 4 seconds is pretty bad. What about the number of calls though?
Looking at the number of calls (or total_time, since total_time = mean_time * calls) gives us a better idea of how relevant a query is. You can make bigger gains by focusing on more frequently executed.
You will notice that I'm also selecting the stddev_time, the standard deviation of time spent executing a query. This metric is incredibly helpful determining whether a query is performing badly in general (low deviation) or sometimes spikes (high deviation). Together with max_time (the maximum time the query needed to execute) this may give a hint to the cause of the query's performance.
Once I have identified a query here are the steps I take:
- Reconstruct the query using actual values. In other words, I take the normalized query and plug in values.
- Run
EXPLAIN ANALYZEon the query to understand how the query is executed. - Identify the slowest parts of the query and look for missing indices.
- Check if and how the table is
CLUSTERed.
There are plenty of ways to continue from there, some of which I'll highlight in a future post about pg_buffercache.